 |
| A Maasai house, called an inkajijik, represents the scarce resources faced by many people in East Africa. This photo was taken in the Eastern Rift Valley of Tanzania near Selela. 2013 photo by Tim Scharks. |
1. Defining Development
In the 20th century, geographers and economists were challenged by the difficulty of gathering data on people from every country in the world. A commonly used measure of development was the total value of a country's production in a year divided by the total population. This value, known as the Gross Domestic Product (GDP) per capita, was popular because it was relatively easily calculated and seemed useful because it gave a quick idea of whether a country was rich or poor.However, using GDP per capita as a measure of how well a country was doing was also criticized for several reasons.
First, while GDP per capita gives a single number as the amount of money theoretically available to every person in a country, it does not account for inequalities in wealth within a country. While it's possible for every person in a country to have an equal share of a country's wealth, it's also possible for the wealth to be distributed extremely unequally. While some inequality seems likely if not inevitable, a distribution of wealth where a few very rich people live very comfortable lives while half or more of the the country faces starvation (as observed in North Korea, for example) is not seen as that country doing well.
Another criticism of the use of GDP per capita is that it doesn't account for wise use of resources. Two examples: a country rich with forests could chop down every tree and sell it as fast as possible, boosting GDP for a few years but leaving them with environmental devastation and a reduced cash flow for generations afterwards. Similarly, a country could put all its children to work in factories instead of supporting their education. GDP would benefit in the short term by having more workers contributing to production, but few of us would agree that a country with lots of child labor and little education is doing well.
A final criticism of the GDP is that while the GDP can be measured using an international currency like the US Dollar, many countries have different costs of living. For instance, a US dollar can purchase more in a country like Guatemala than it can in the United States, but the same dollar can't purchase as much in Japan or Germany.
A solution to measuring development: the Human Development Index
In 1990 the United Nations created an official measure of development called the Human Development Index (HDI). The HDI is a composite of three dimensions that development experts agreed were universal human goals for success: a long and healthy life, knowledge, and a decent standard of living.The measure of a long and healthy life, life expectancy at birth, was introduced in Chapter 5. Life expectancy at birth is calculated by averaging out everyone's age of death. In general the healthier a society is, the longer it lives on average, and the longer the average life expectancy is.
The HDI measures knowledge in two ways. First, the HDI includes the average years of school completed by adults aged 25 years and older. Next, the HDI also includes the average years of school completed by the current generation, called "expected years of schooling." The first measure establishes how well educated the current working-age adult population is, the second is a more sensitive measure of how well educated the next generation of workers will be.
The last dimension, a decent standard of living, is somewhat like GDP. The HDI uses Gross National Income per capita, which for most countries in the world is nearly the same as GDP per capita. But to account for varying costs of living between countries, the GNI per capita is adjusted for what's called Purchasing Power Parity--that is, the per capita GNI is inflated in countries where a dollar goes farther (as a hypothetical example, from $2,000 per person to $2,700 per person) but deflated where a dollar doesn't buy as much (perhaps from $43,000 to $37,000). This measure is called the Gross National Income per capita adjusted for purchasing power parity, or GNI per capita PPP for short.
The GNI per capita PPP is still subject to the criticism that it doesn't account for inequality within a country. When Jeff Bezos (the founder of Amazon) walks into a classroom, on average everyone's wealth is in the billions of dollars, yet no-one is actually wealthier. However, the GNI per capita PPP is only one of three measures included in the HDI. The other measures cannot be affected by extreme inequality nearly as much, since the maximum human life span is just over 100 years and the maximum years of education is around thirty years. Thus, the measures of life expectancy and education make the HDI reflect all of a country's population and inequalities in health or knowledge show up as a low average life expectancy or years of education.
 |
| The United Nation's Human Development Index (HDI) is a measure of development that considers a country's average life expectancy, education, and economic standard of living. Image by the United Nations Development Programme at http://hdr.undp.org/en/content/human-development-index-hdi, used under Creative Commons Attribution 3.0 IGO license. |
2. Contrasts in Development
The opening photo to this chapter of a traditional Maasai house should emphasize how unequal development is around the world; even those of us who feel poor compared to our peers have many more resources available to us than the Maasai family who lives in that structure. Just think: running water...flush toilets...electricity...Each component of the HDI has a wide range across the countries of the world. Here are two of the components of HDI, life expectancy and GNI per capita PPP:
The shortest life expectancies are close to 50 years, and the longest are over 80. The poorest countries in the world have GNI per capita PPPs of well under $1,000, while the wealthiest are $50,000 or higher. As mentioned in Chapter 5, a major contributor to low life expectancies is the infant mortality rate: countries with short life expectancies have high rates of infant and child deaths compared to wealthier countries with longer life expectancies.
Similar extreme differences in knowledge can be observed. Here an interactive map from Our World in Data shows mean years of schooling for working-age adults from 1950 to 2010, press the play symbol to watch the trends over time:
Note that while the mean years of schooling has increased worldwide, there are places with much greater average education than others in 2010 just as in 1950.
The result of these disparities means that the most developed countries have very high measures of development, while the least developed countries have low figures in all the components of the HDI. However another observation can be made: there are more countries "in between" low and high development today than in previous decades. Describing countries as belonging to "first world" and "third world" groupings is no longer accurate, and in fact has not been accurate for several decades. Rather, there is a continuum of development status, with some countries nearly fully developed, others in a "middle developing" status, and still others that are "low developing."
3. Increases in Human Development
The good news about development is that we have seen major increases in development around the world. With few exceptions, the world is a wealthier, smarter, healthier place today than any time in history. Here's one way of considering our progress as measured by the organization Our World in Data: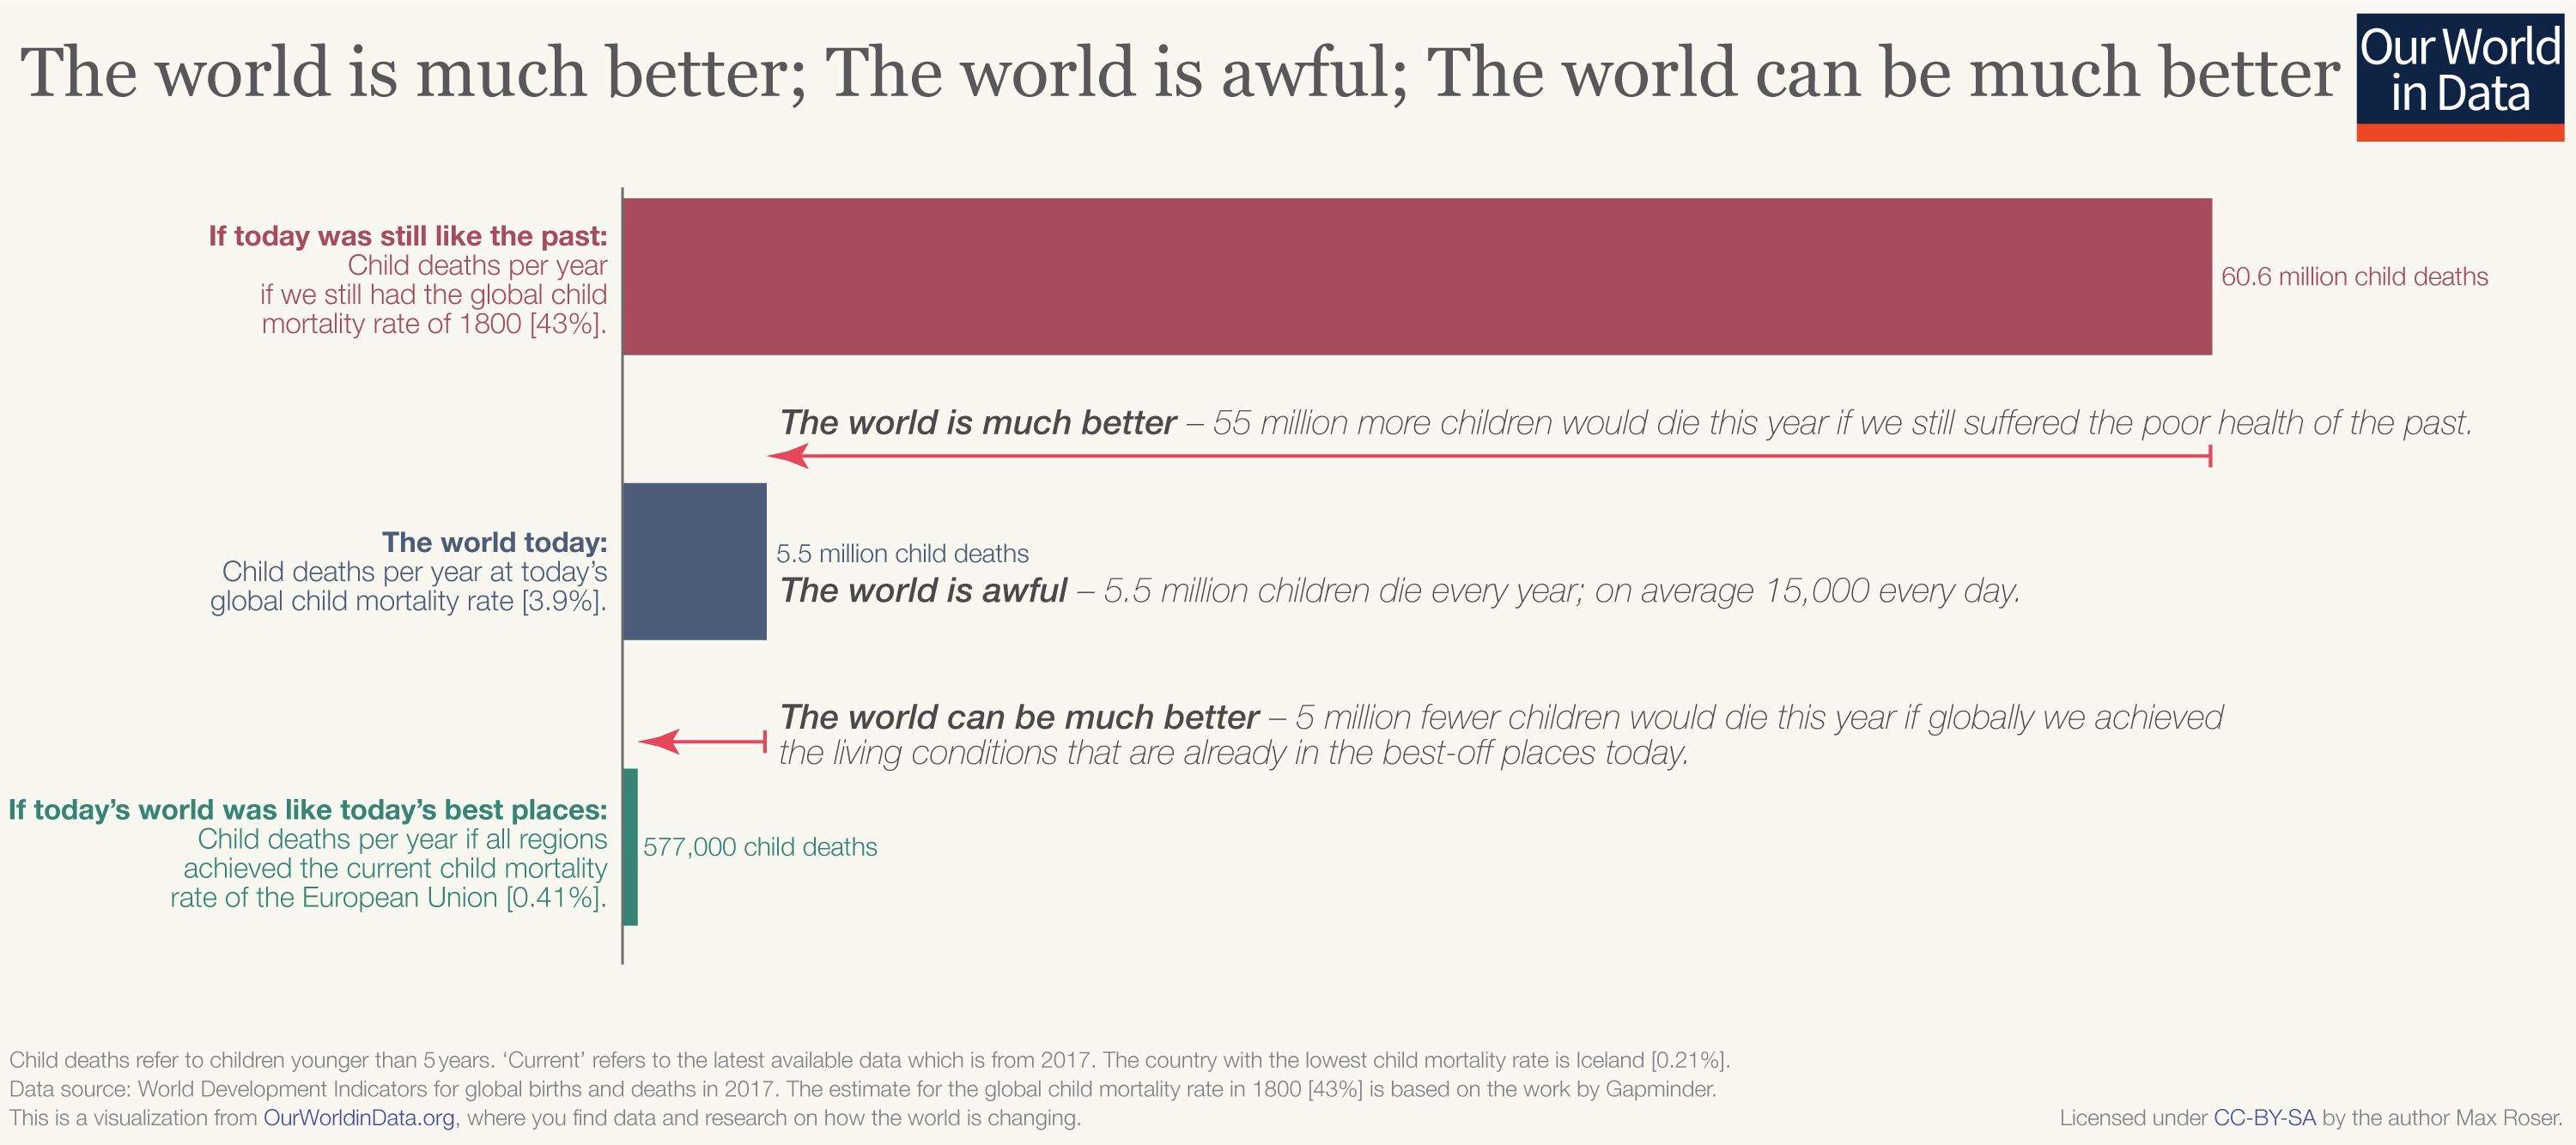
You may need to click on the image to read the details. The message is interesting: if we look at the present levels of child mortality, the decrease of which is tied to increases in life expectancy, we can be shocked at how high it is ("the world is awful") compared to what it might be if everywhere on Earth was at a high level of development. Yet if we consider how many children would die every year if the mortality rates of 1800 were still around, then we can conclude "the world is much better." These views are not contradictory, but rather different sides of the same coin. The final message, "the world can be much better" is also a worthy one--there are nearly 5 million children dying every year than we would expect if every place on Earth were highly developed.
Another way to see the progress in development around the world is by examining the percentage of the world's population that lives in absolute poverty. Another graphic from Our World in Data illustrates the drop in extremely poor people as a percentage of the world's population:
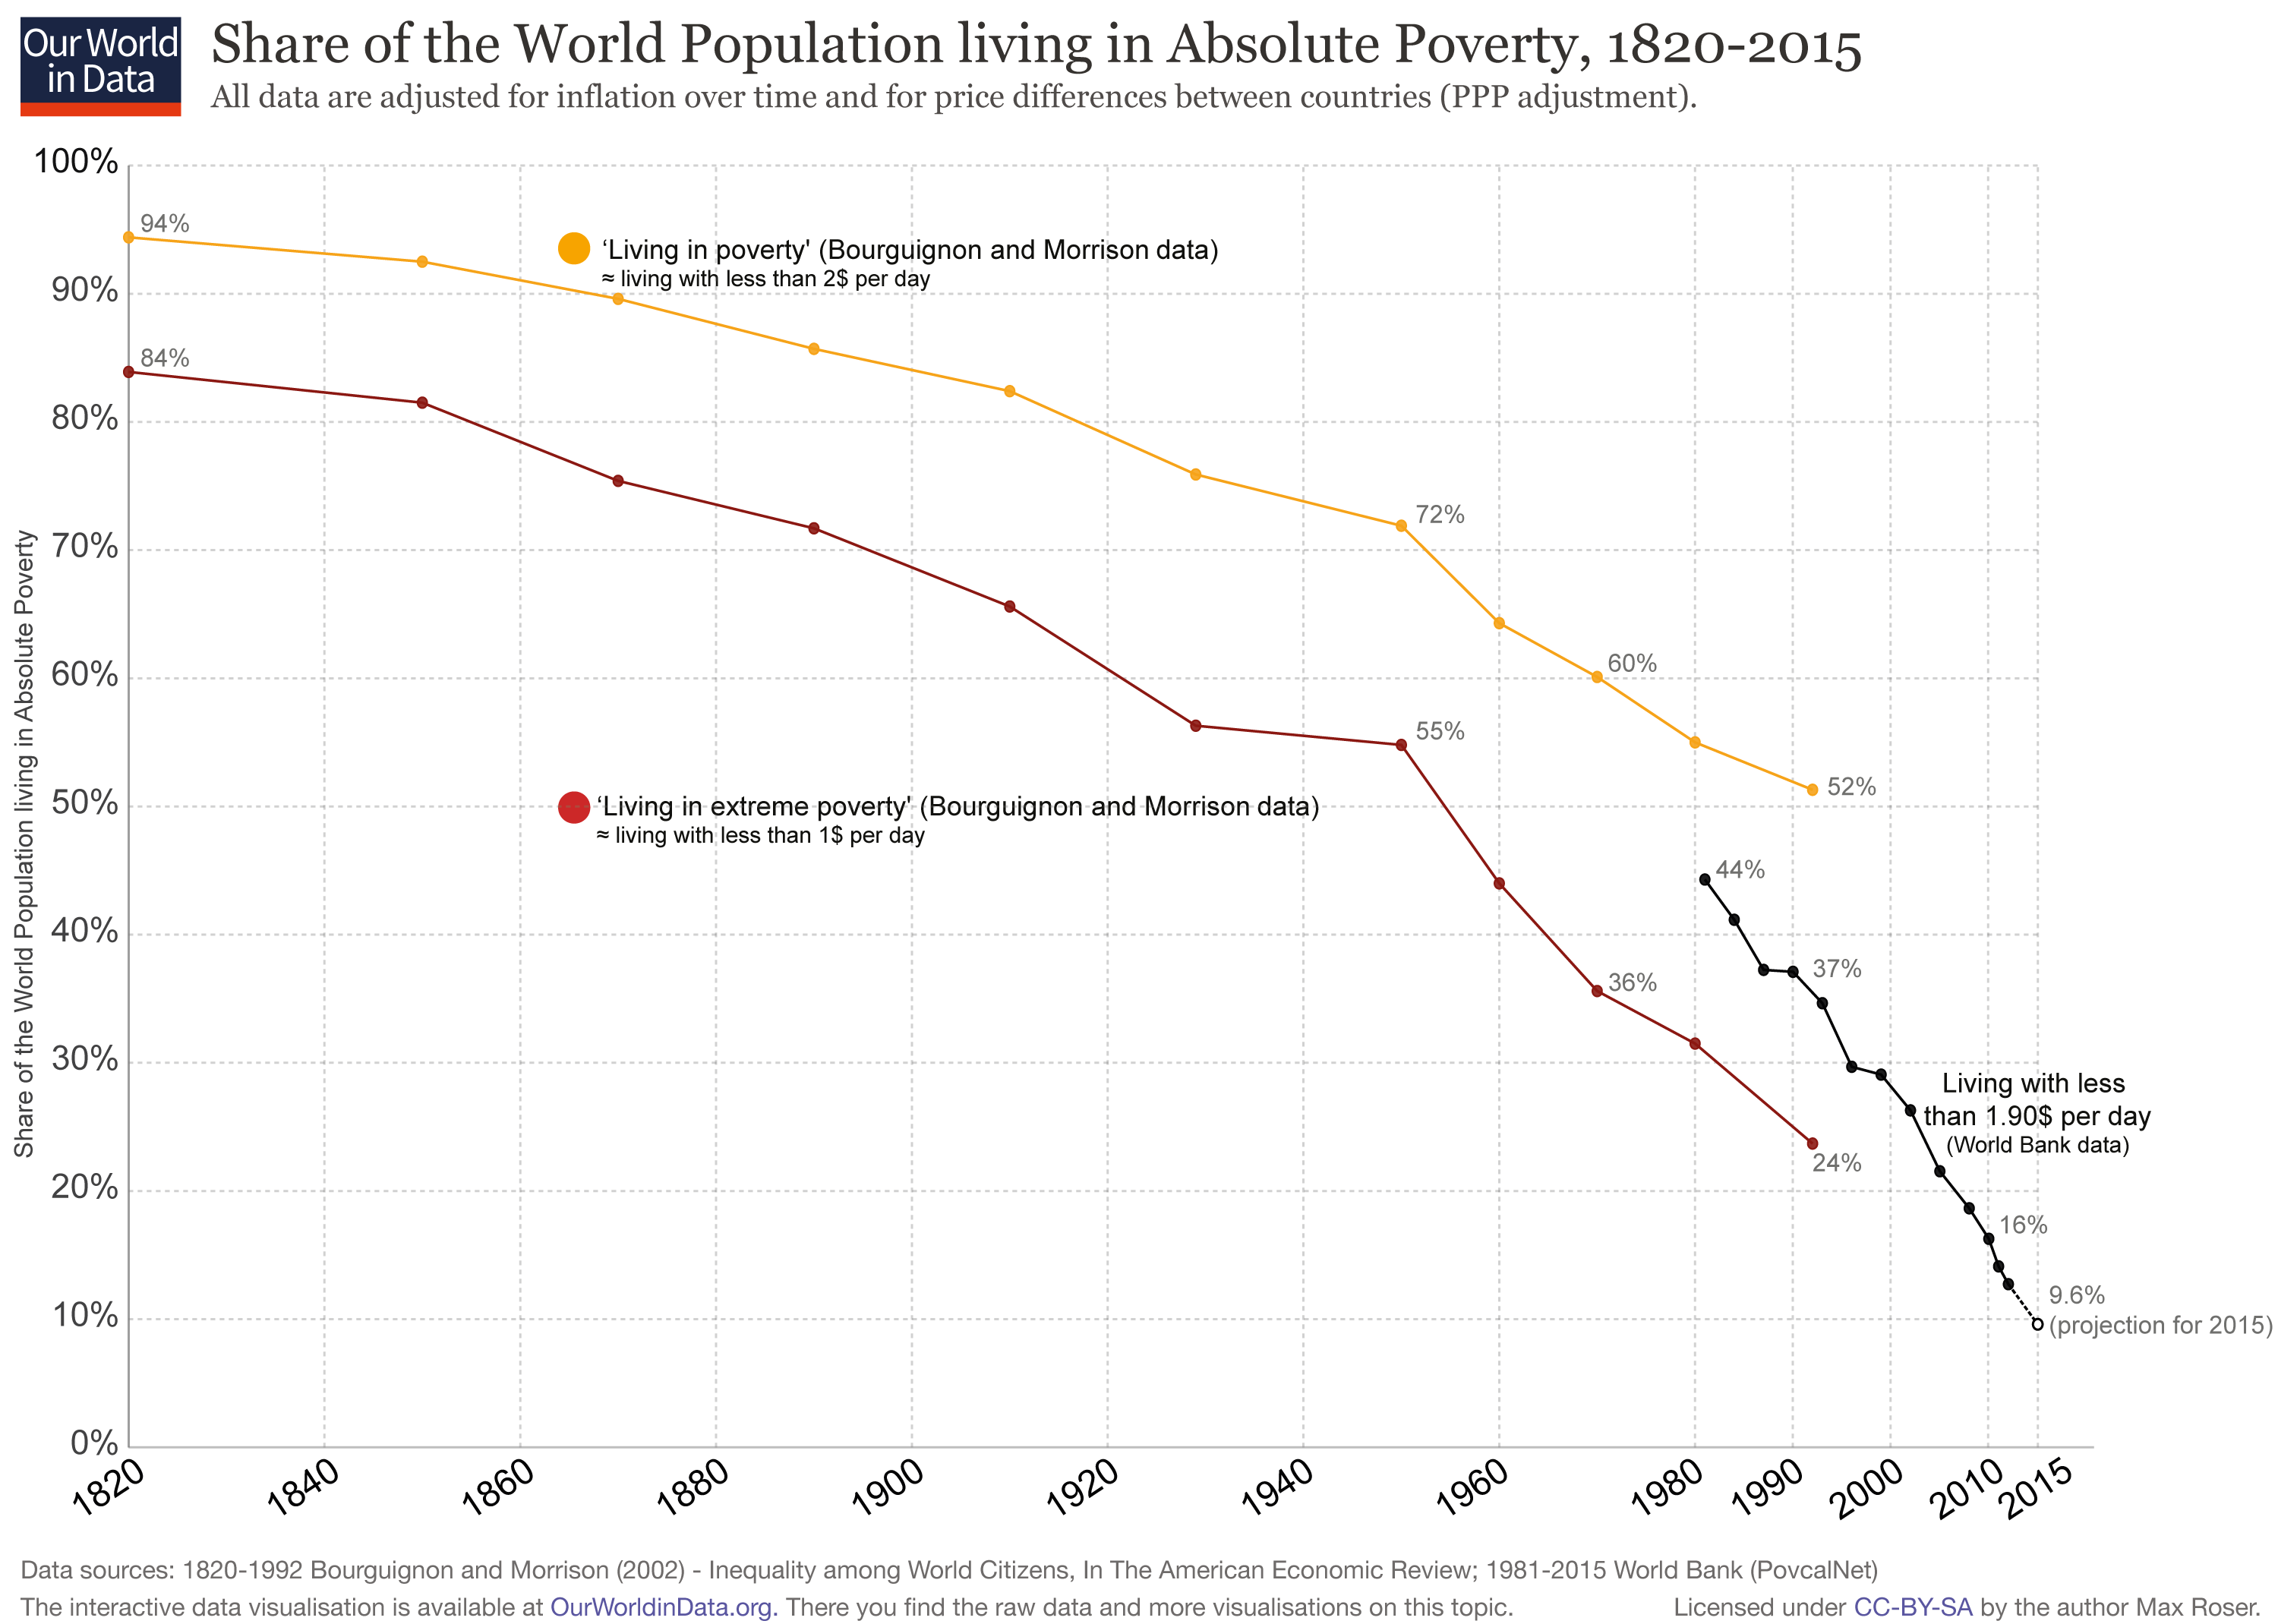
The level of "absolute" poverty has been defined as earning less than US $1.00, less than US $2.00, and less than US $1.90 per day. While the definition of absolute poverty may be up for some debate, the trend is not: there is a smaller share of the world living in absolute poverty today than any time in the past.
4. Does International Trade Cause Human Development?
International trade is often blamed for a country's problems. In the United States, both liberal politicians like Bernie Sanders and conservative ones like Donald Trump have spoken out against the US's involvement in international trade agreements; in 2019 the United States is involved in an escalating trade war, especially with China.Most evidence we have, though, is that increased trade is associated with GDP growth:
In this chart we see that countries with greater growth in exports (higher up) are those that saw more growth in GDP (farther right). The evidence appears to support that countries engaged in more international trade see larger increases in their economies.
Last updated November 19, 2019